
Built in Tampa for listing agents
Your next listing is already in your farm.
See which owners are likely to sell, what their home is worth, and what they would walk away with. Then match your buyers to homes that are not on the market yet.
Buyer match
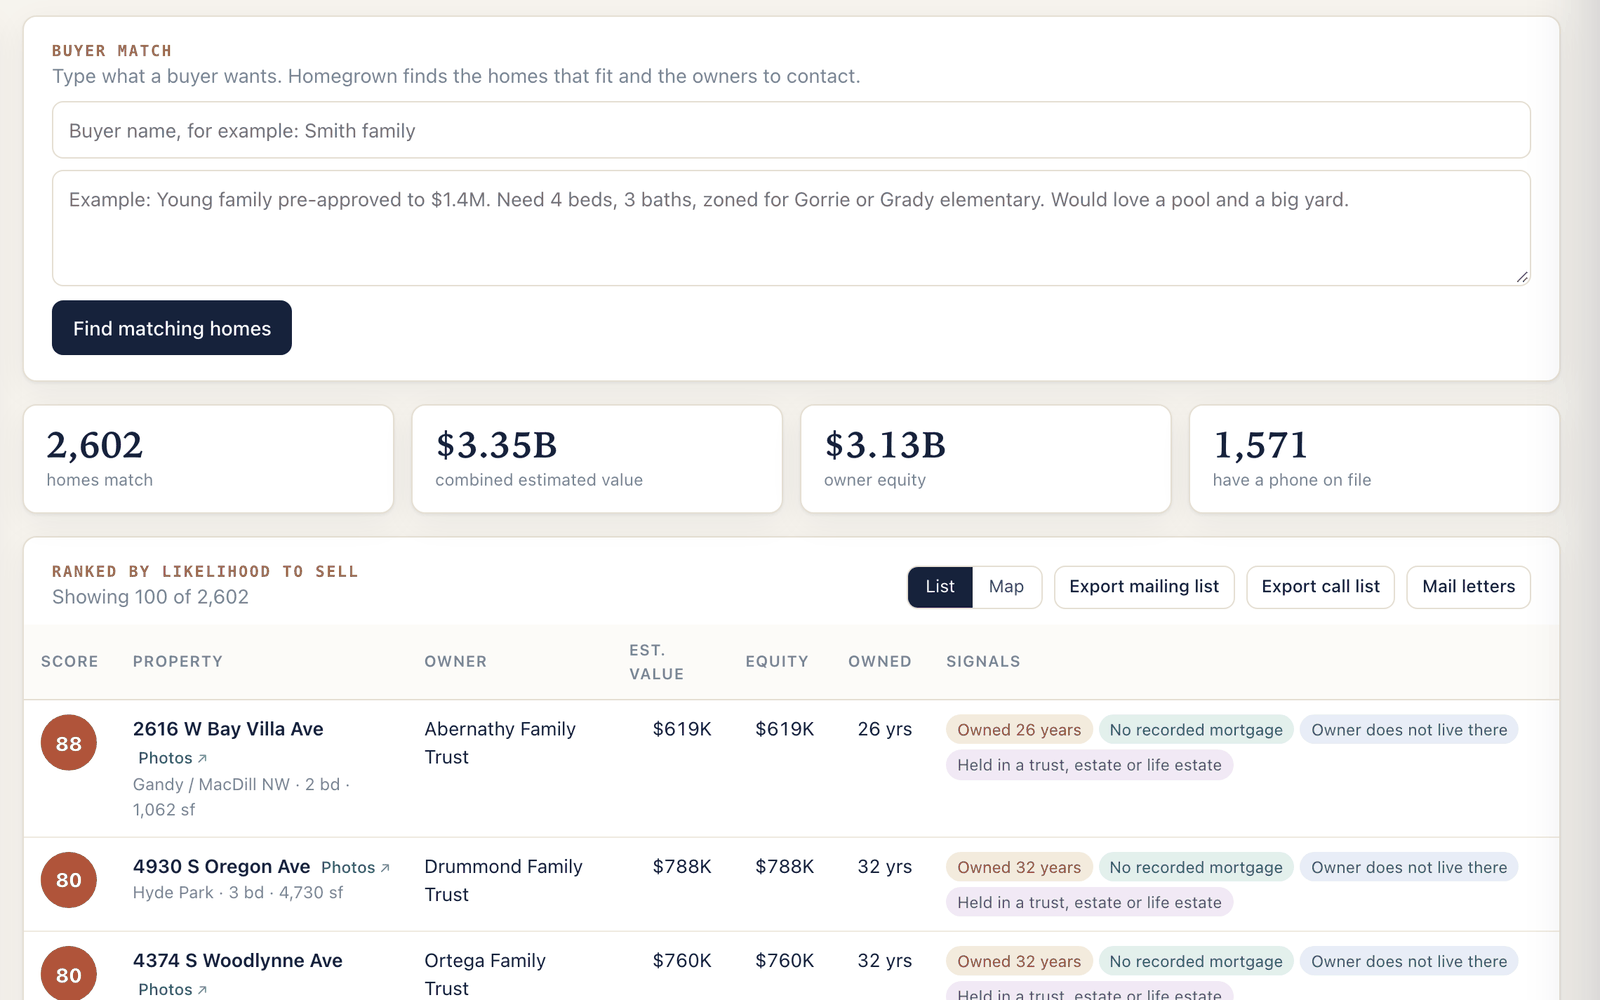
Type what your buyer wants. Get the owners to call.
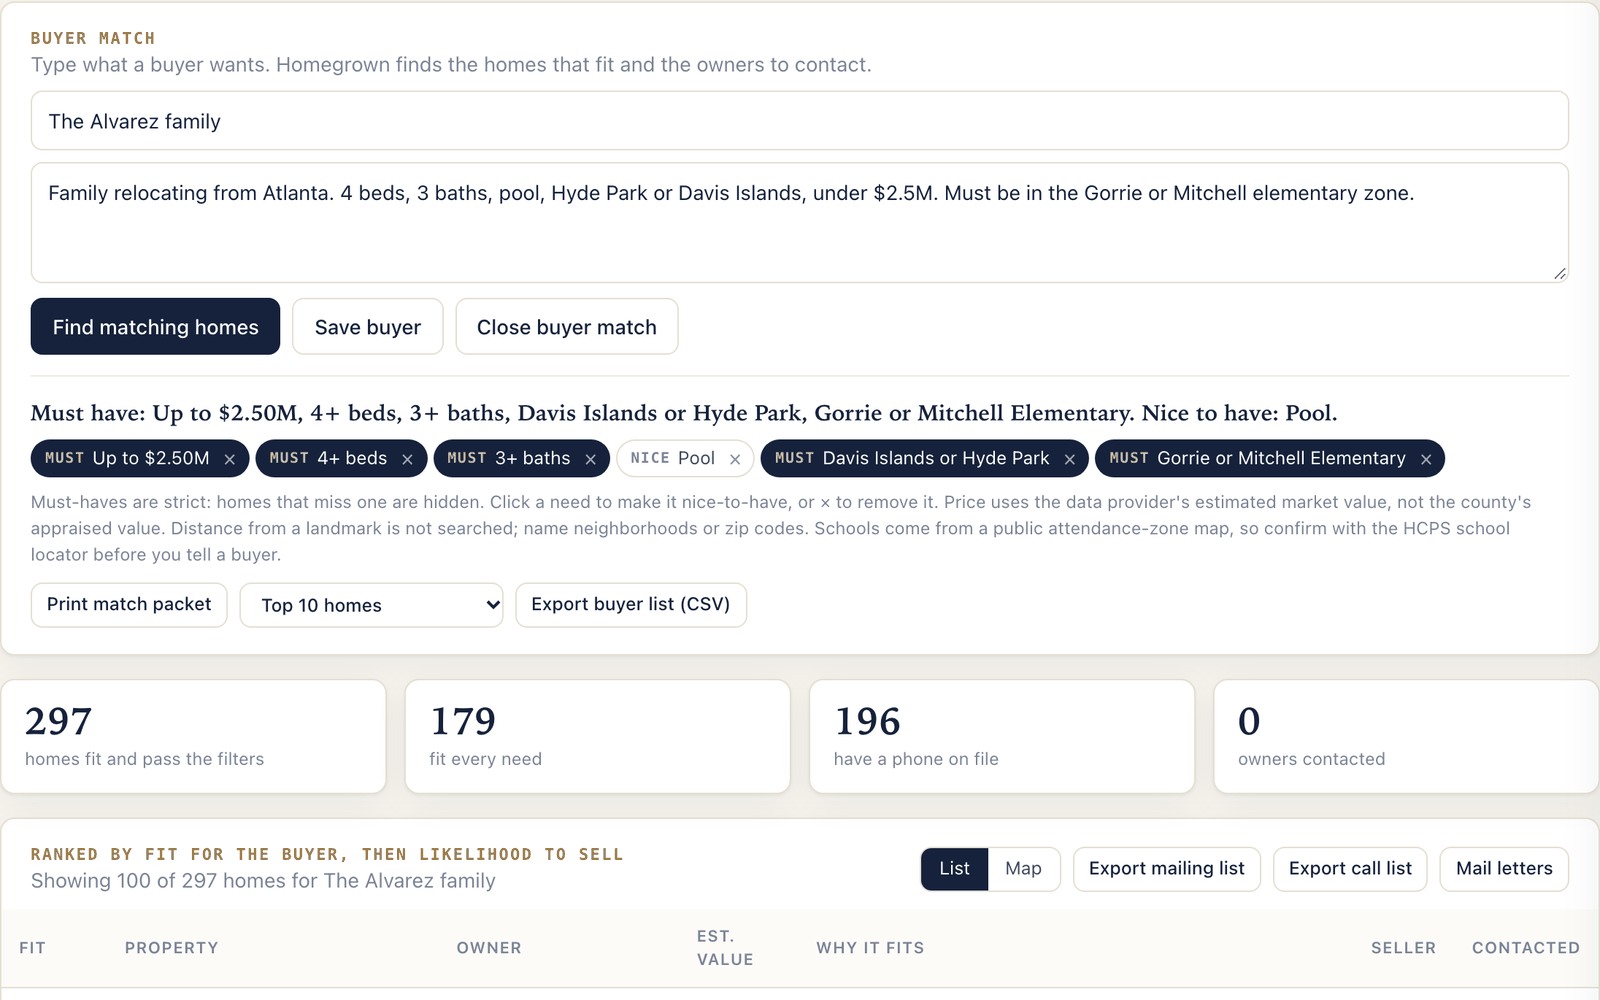
Write the buyer's needs the way you would say them: price, beds, baths, area, school zone, pool. Homegrown reads the notes, sorts must-haves from nice-to-haves, and finds the homes that fit, on the market or not.
- Owner name and mailing address for each match, plus a phone when one is on file
- A daily list of the next owners to contact
- A printed packet with one page for each home
Seller Radar
Know who is likely to sell before they call anyone.
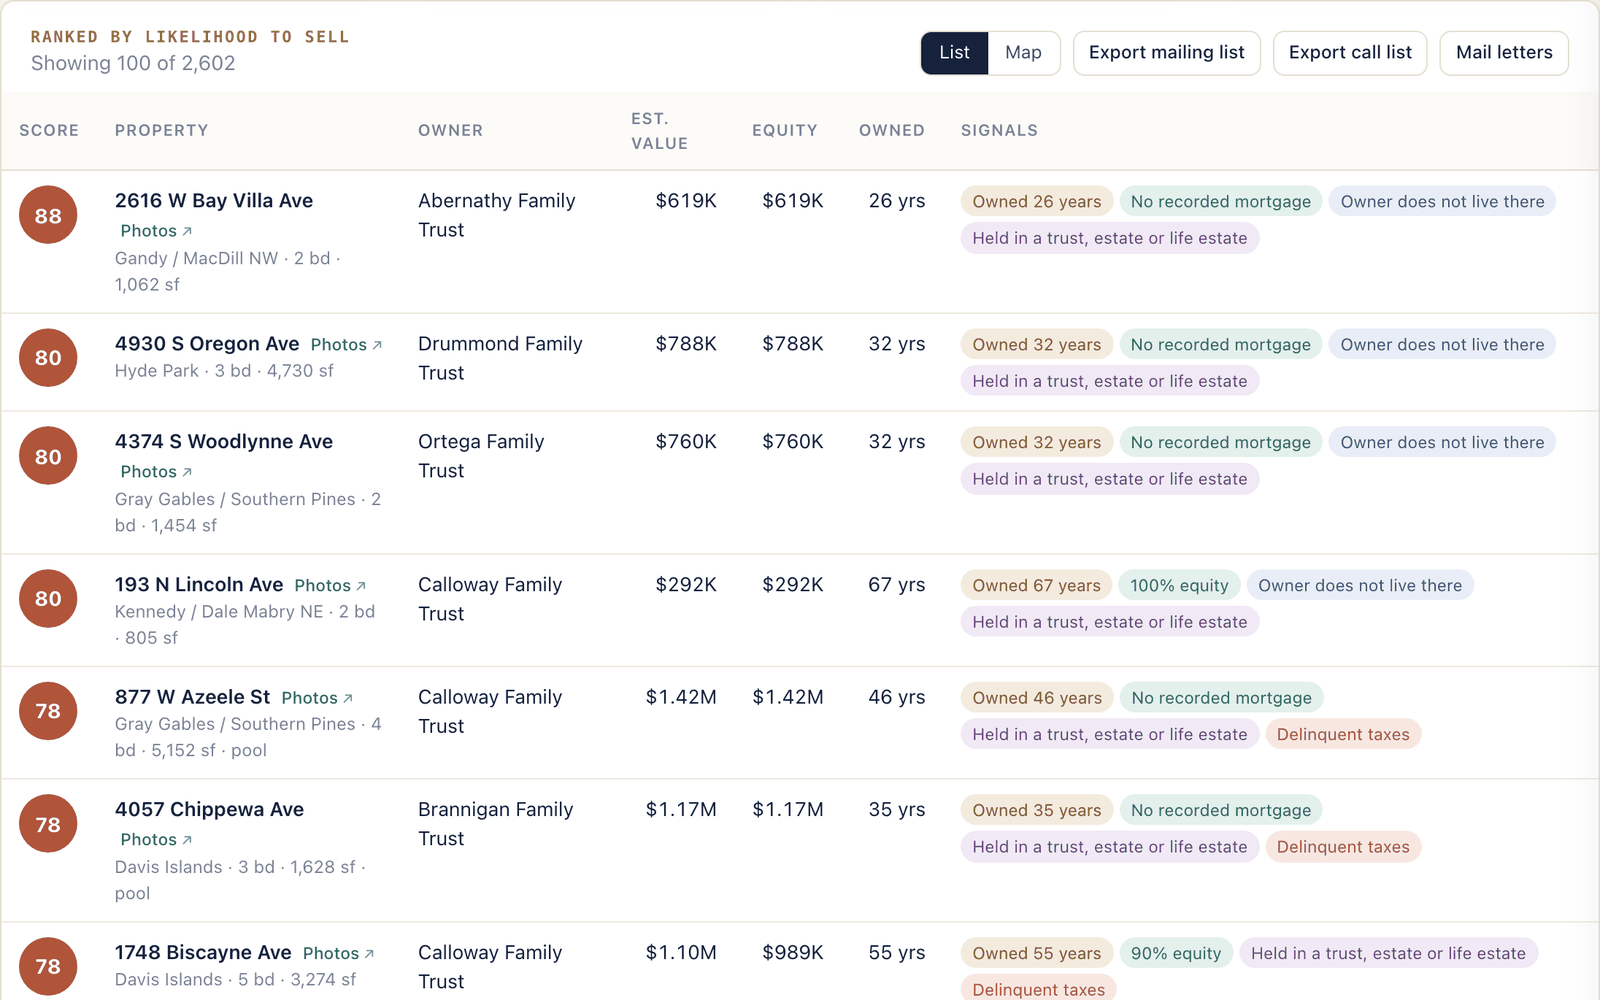
Every home gets a seller score from the county record: years owned, equity, absentee and out-of-state owners, trusts and estates, and more. Filter by neighborhood, price, beds, baths, flood zone and the signals you care about.
- Each score shows the reasons behind it
- Export a mailing list or a call list in one click
Map view
See your whole farm on one map.
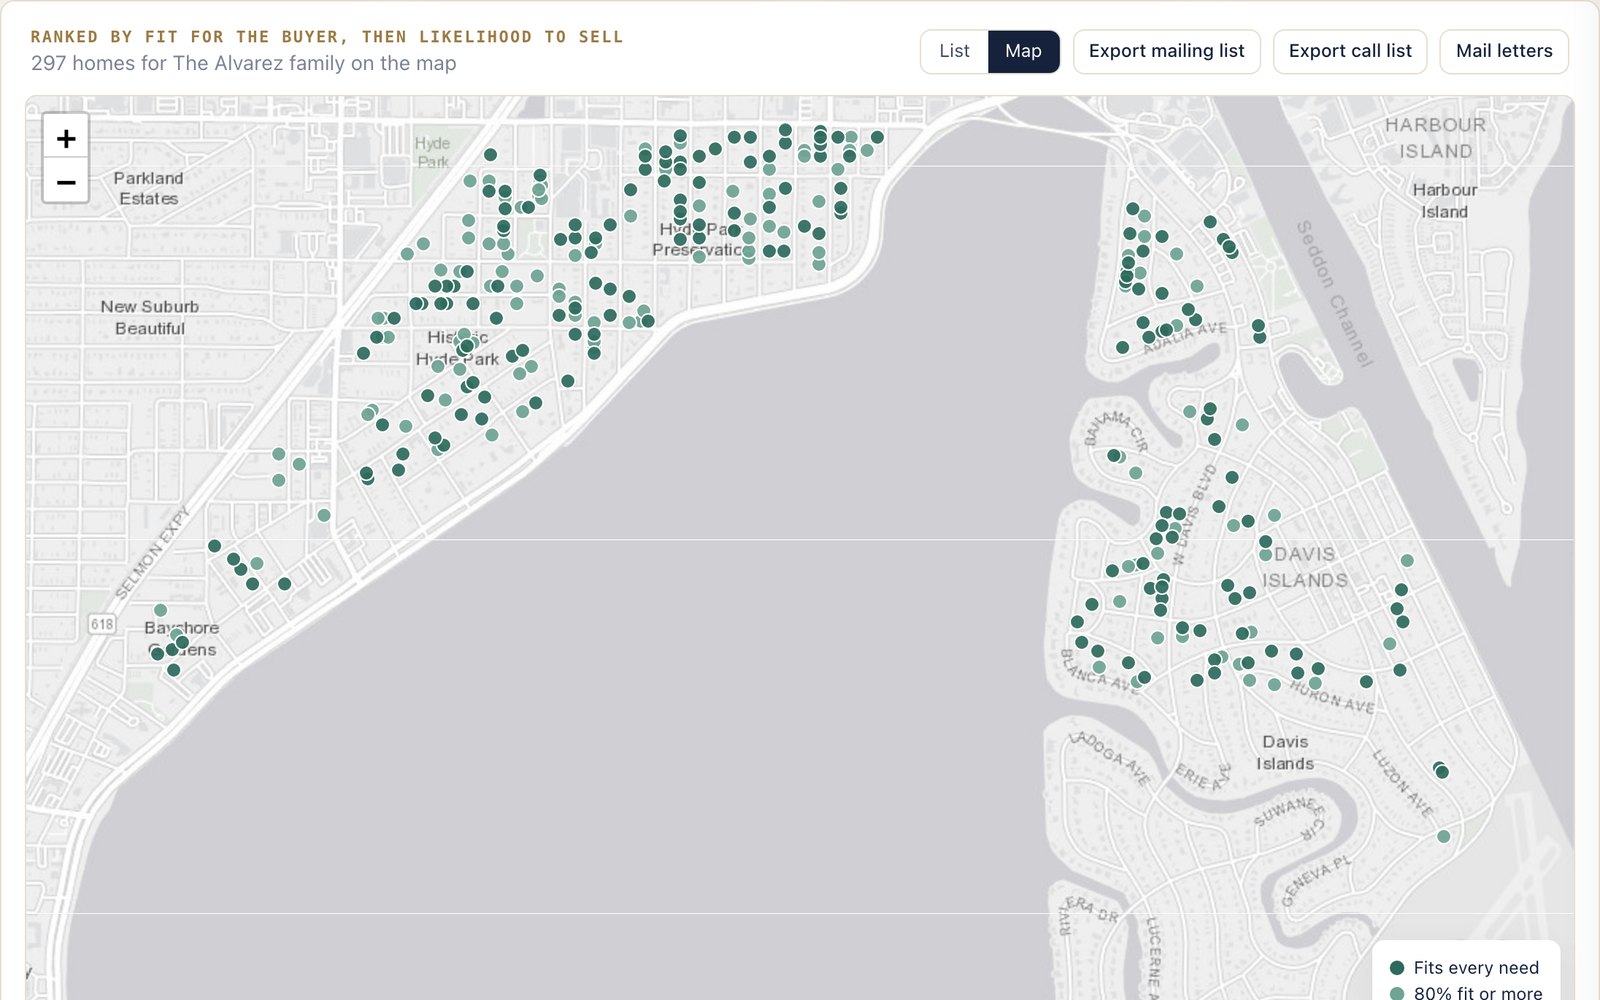
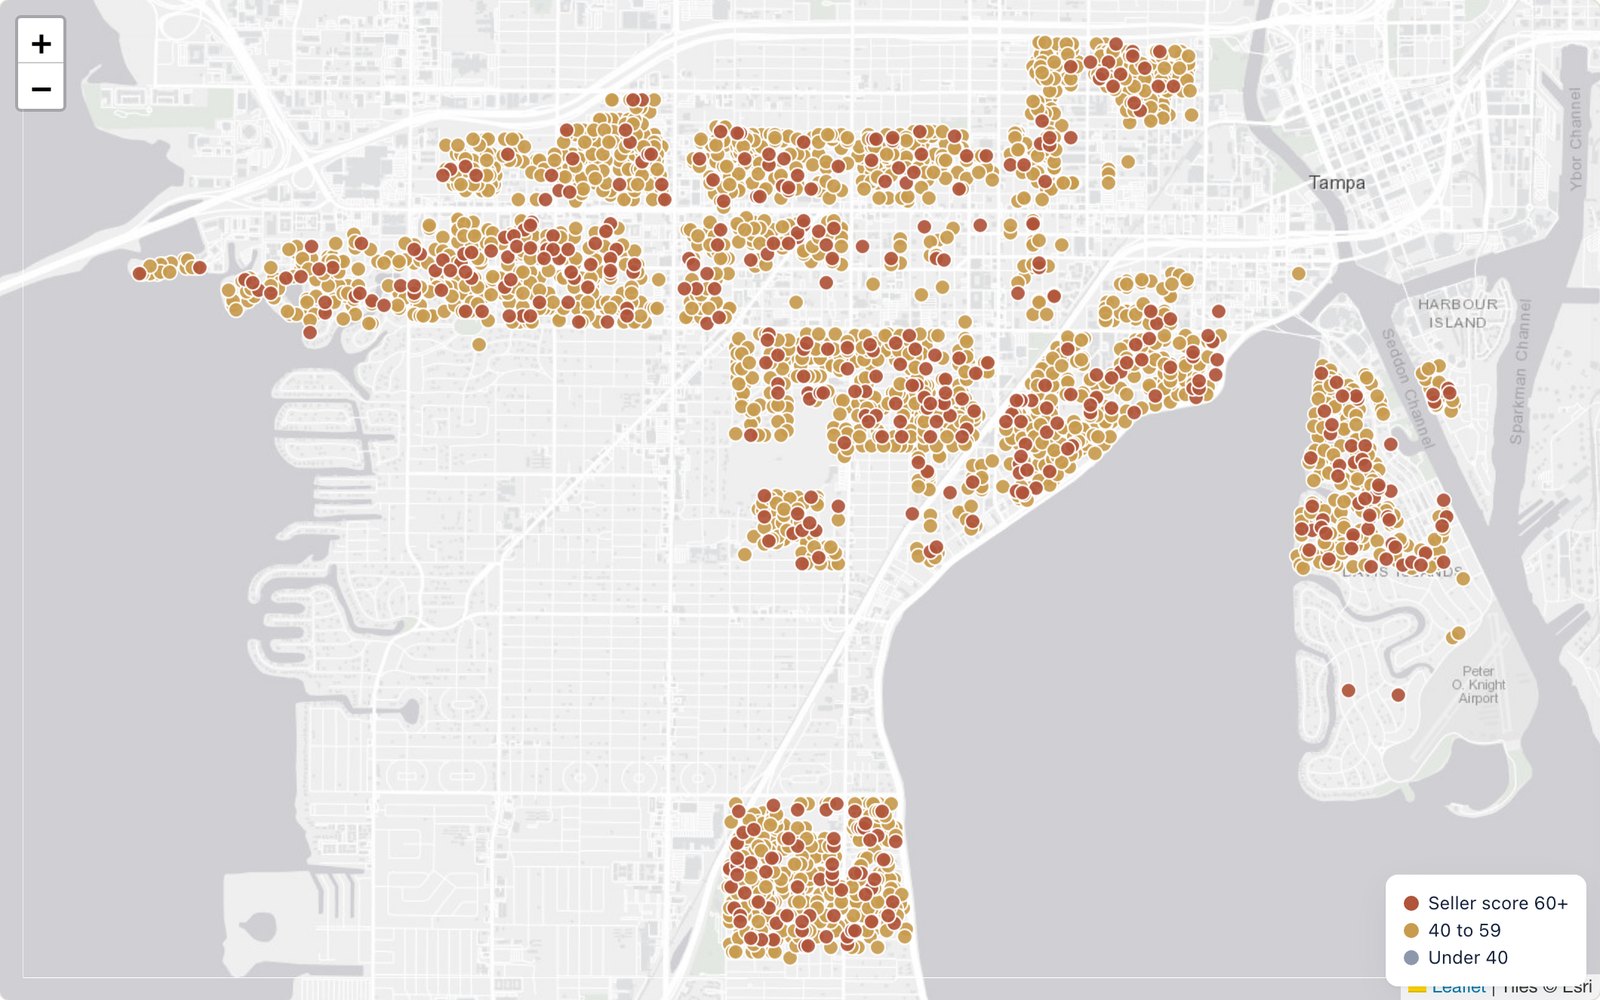
Narrow the list, then switch to the map. Each dot is a home, colored by how likely the owner is to sell. Click a dot to open the home.
The two outlines show where the homes left after the filters are: the main South Tampa neighborhoods, from Beach Park to Davis Islands, and Gandy / MacDill to the south. A few scattered homes fall outside them.
 South Tampa
Gandy / MacDill
Every home, one view
Value, score and owner, side by side.
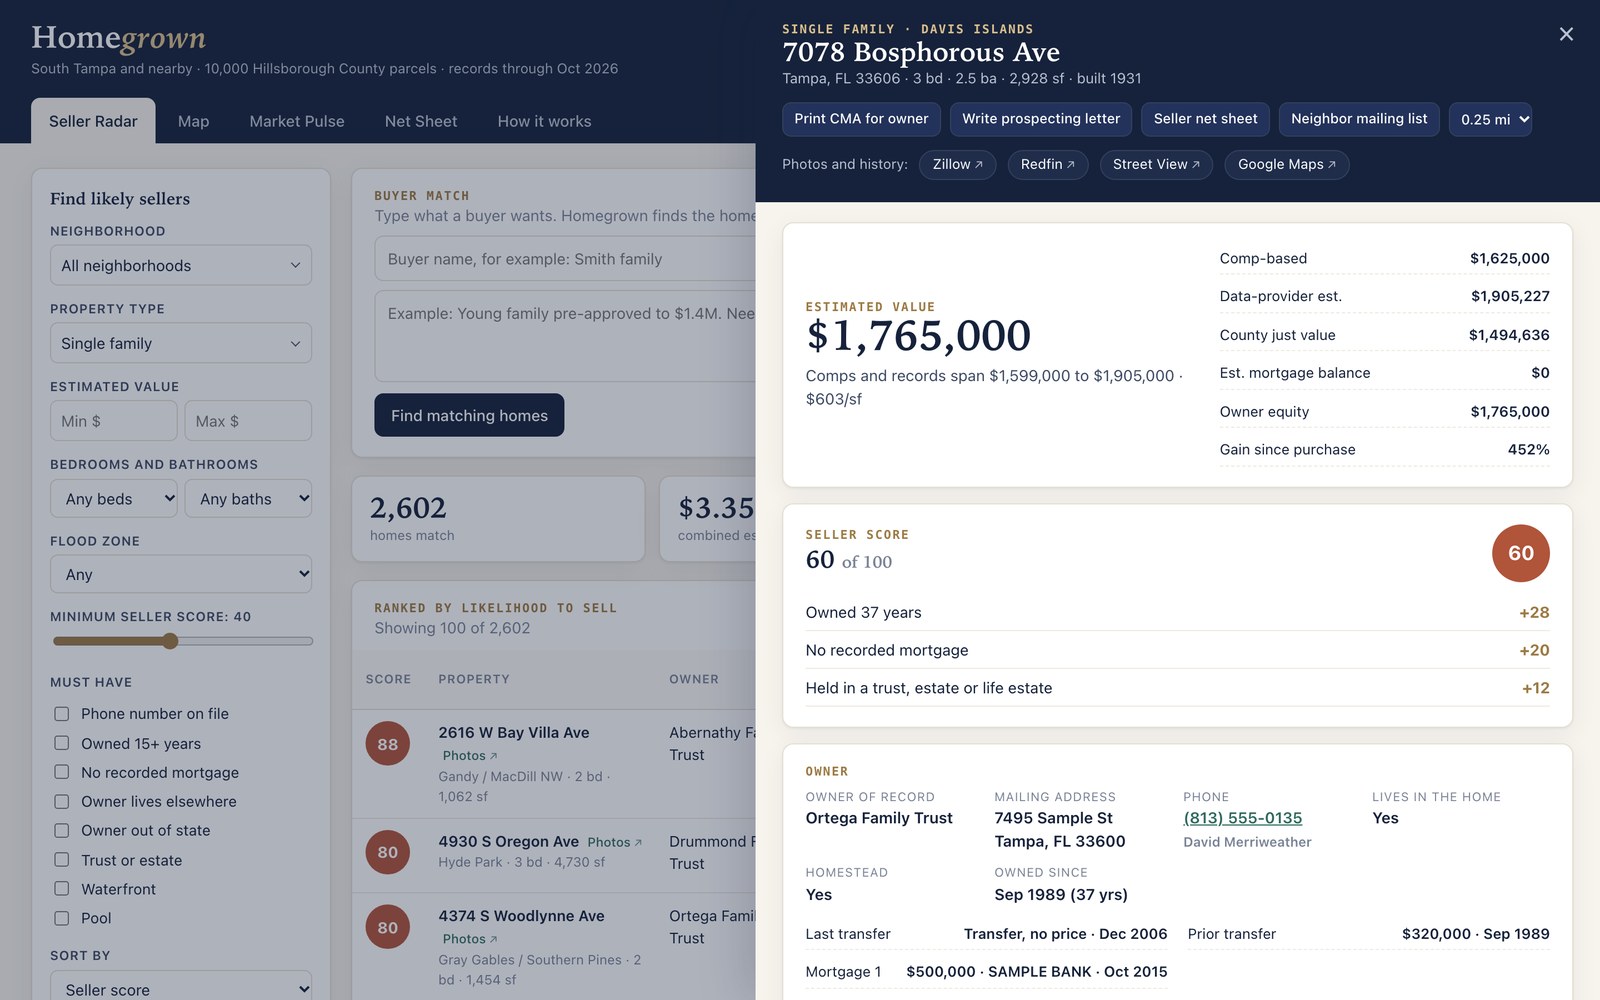
Open any home to see its estimated value from recent comparable sales, why it scored the way it did, and who owns it. Links to photos, Street View and the sale history are one click away.
Seller net sheet
Show the seller what they walk away with.
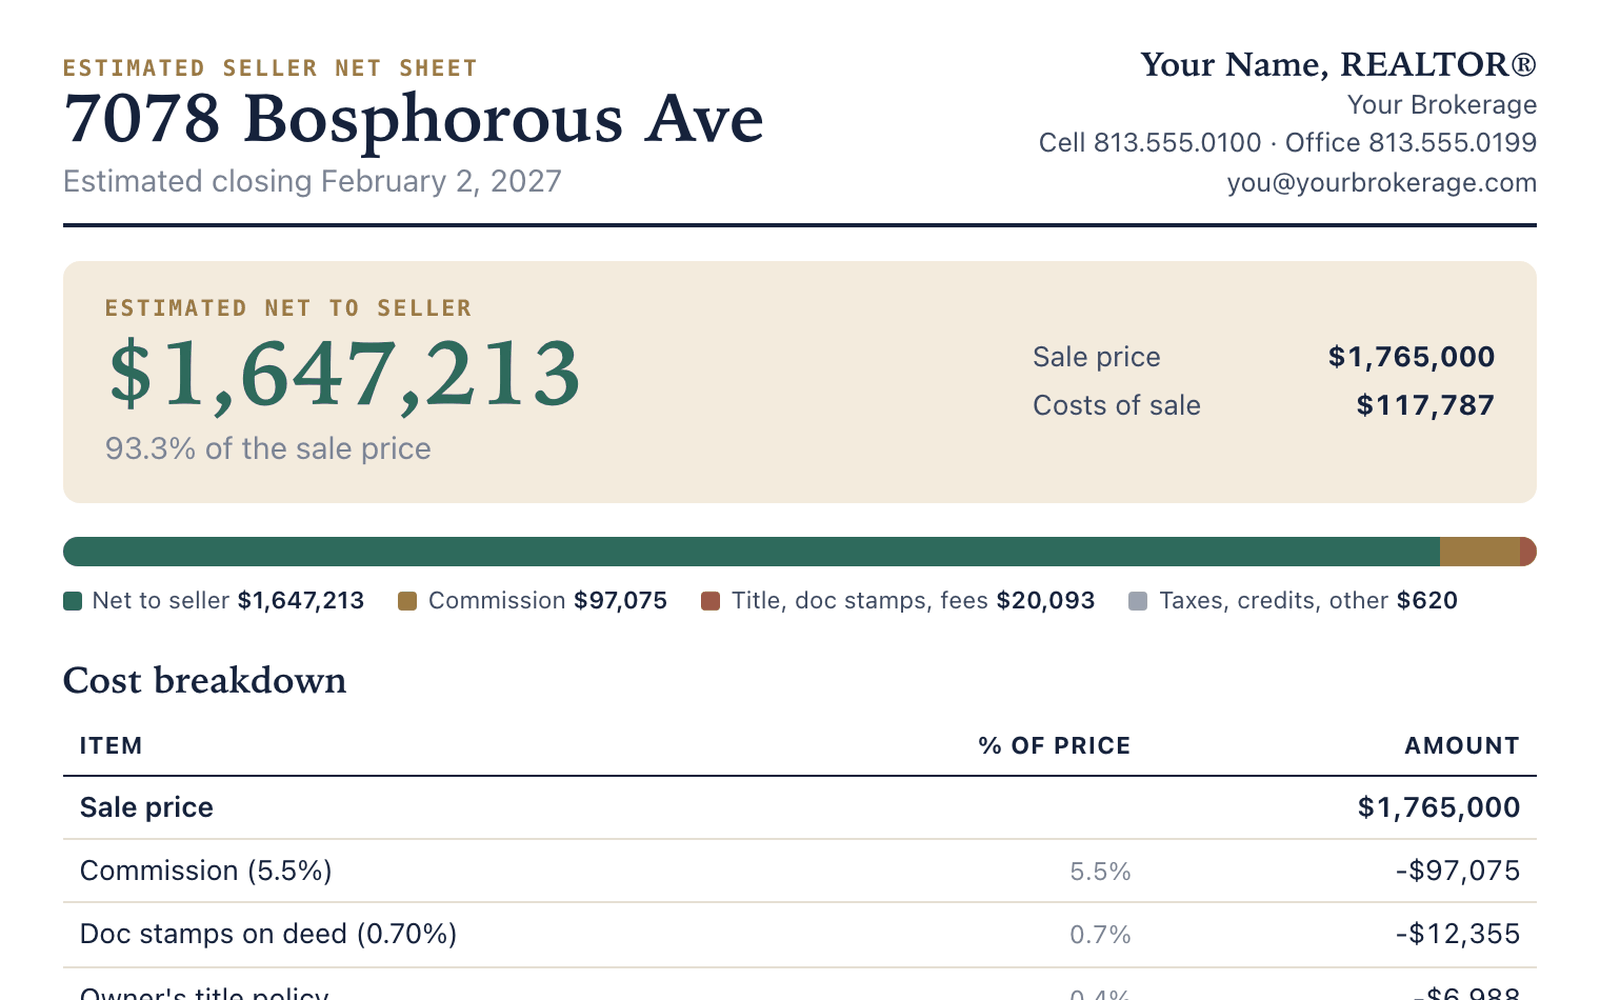
The Florida net sheet has deed doc stamps, the owner's title policy and the tax proration built in. It prints with a listing timeline from the first meeting to closing day.
Home value report
A clean value report for the owner.
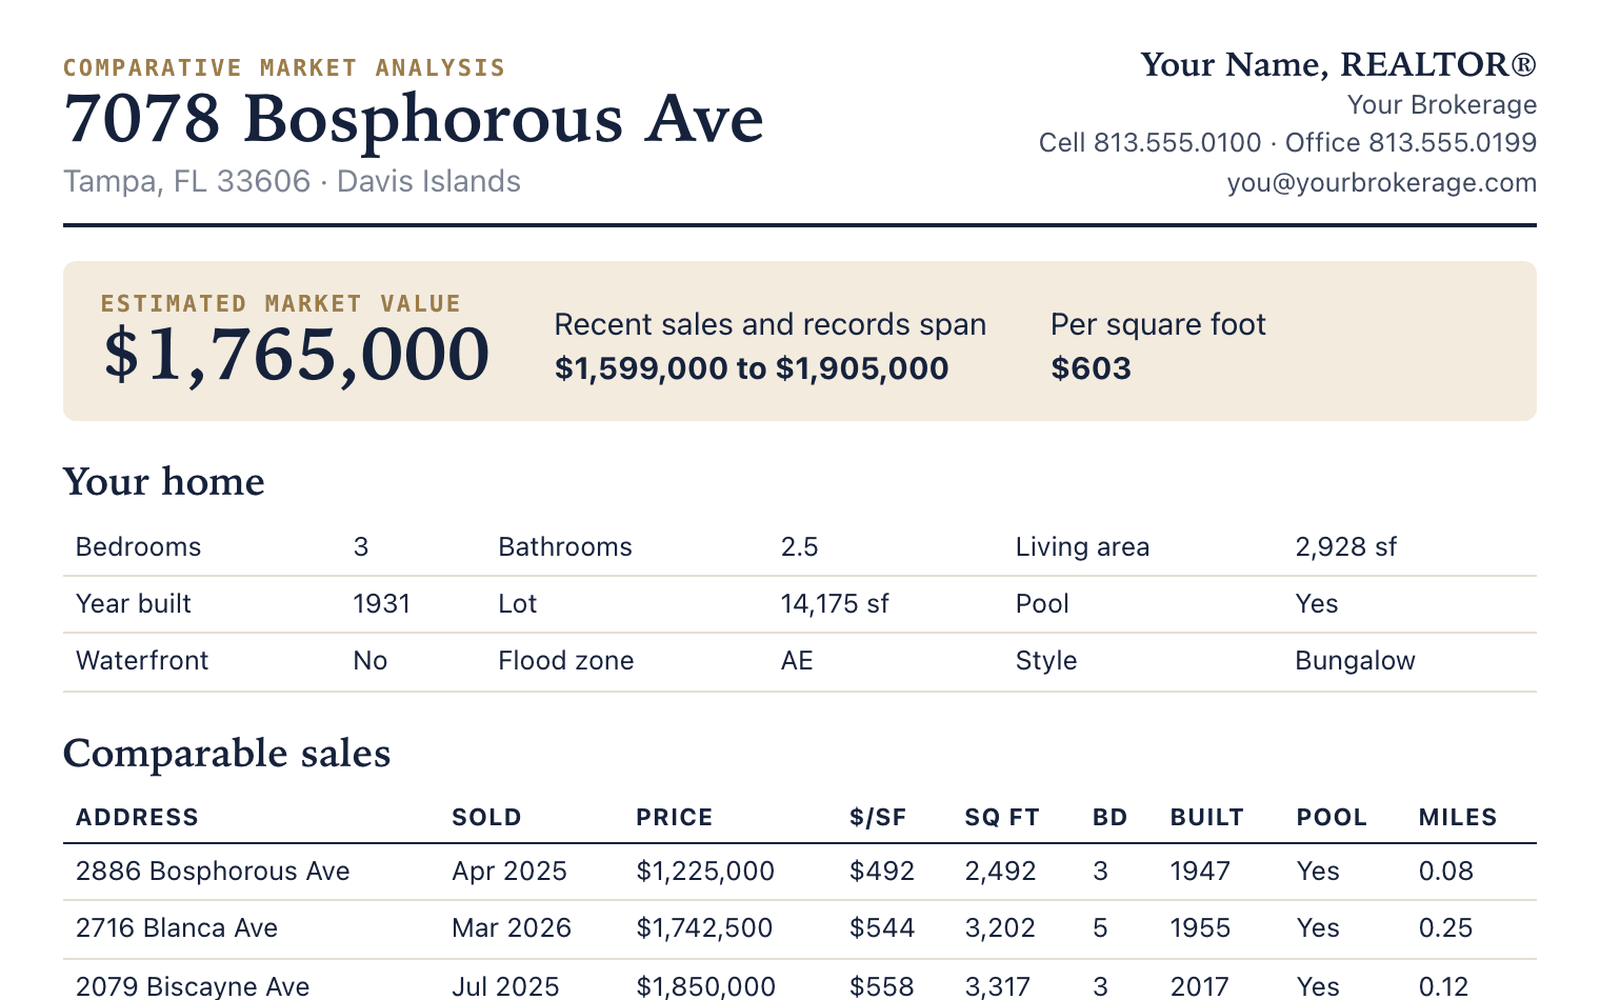
Print a comparative market analysis with the recent sales nearby, the home's details and the neighborhood's last 12 months. Your name and brokerage go on every page.
Prospecting letters
A letter written for each owner. Change any word.
Homegrown writes the letter in seconds from what it knows about the home: how long they have owned it, what nearby homes sold for, and whether it is a rental or held in a trust. Then click into any paragraph and change any word before you print. Your edits save for that home.
Coming soon Mail letters straight from the app.
Cell 813.555.0100 · Office 813.555.0199
you@yourbrokerage.com
Ortega Family Trust
7495 Sample St
Tampa, FL 33600
Dear Homeowner,
You have owned your home on Bosphorous Ave for 37 years. Davis Islands has changed a lot in that time, and so has what homes like yours are worth.
Over the last 12 months, 13 homes in Davis Islands sold at a median of $2,150,000, or about $584 per square foot. That is down 1.1% per square foot from the year before.
Recent sales near 7078 Bosphorous Ave and public records put homes like yours at roughly $1,599,000 to $1,905,000. Condition and updates move that number a lot, so I would be glad to give you a real figure after a short visit.
If you are planning for a family property or settling an estate, I can walk you through the steps and timing without any pressure, and connect you with local attorneys and title partners I trust.
There is no obligation. If you are curious, call or text me at 813.555.0100 and I will put together a free, private market report for your home.
Warm regards,
Your Name
Market Pulse
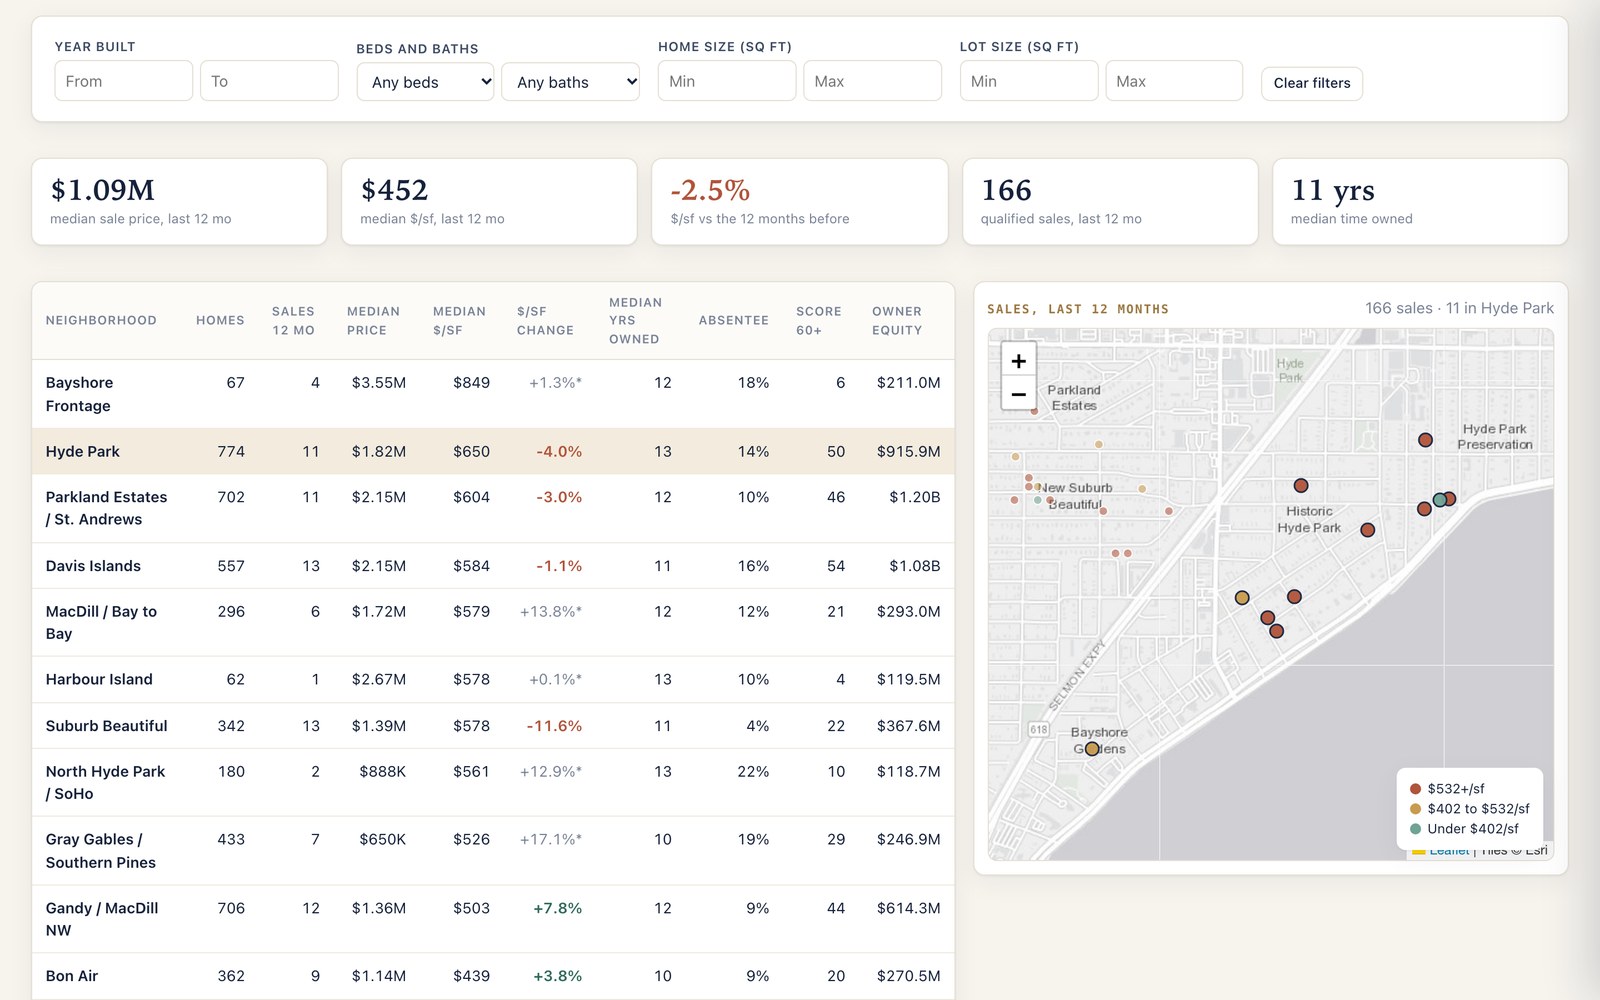
Your market by neighborhood, with the sales on a map.
Median price, price per square foot, the change from last year and how long owners stay. Filter by year built, beds, baths, home size and lot size, and every number updates.
How it works
From county record to listing appointment.
- We load your market.Homegrown starts from the county property record for the neighborhoods you farm.
- You pick who to reach.Sort by seller score, or type a buyer's needs and get the owners whose homes fit.
- You show up ready.Print the value report, the net sheet and a letter with your name on them.
See your farm in Homegrown.
Tell us where you work. We will show you the likely sellers there.
Talk to us